1. Motivation
How much can traders learn from past price signals? It depends on what kind of assets sell. Suppose that returns are (in part) a function of  different feature-specific shocks:
(1) 
If  is identifiable, then different values of have to produce different values of
  . This is only the case if assets are sufficiently different from one another. e.g., consider the analogy to randomized control trials. In an RCT, randomizing which subjects get thrown in the treatment and control groups makes it exceptionally unlikely that, say, all the people in the treatment group will by chance happen to all have some other common trait that actually explains their outcomes. Similarly, randomizing which assets get sold makes makes it exceptionally unlikely that
  different choices of and
  can explain the observed returns.
This post sketches a quick model relating this problem to housing prices. To illustrate, imagine  houses have sold at a discount in a neighborhood that looks like this:

The shock might reflect a structural change in the vacation home market whereby there is less disposable income to buy high end units—i.e., a permanent shift. Alternatively, the shock might have been due to a couple of out-of-town second house buyers needing to sell quickly—i.e., a transient effect. The houses in the picture above are all vacation homes of a similar quality with owners living in LA. Since there is so little variation across units, both these explanations are observationally equivalent. Thus, the asset composition affects how informative prices are in an important way. The main empirical prediction is that in places with less variation in housing amenities, there should be more price momentum since it’s harder to distinguish between noise and amenity-specific value shocks.
2. Toy Model
Suppose you’ve seen  sales in the area. Most of the prices looked just about right, but some of the houses sold for a bit more than you would have expected and some sold for a bit less than you would have expected. You’re trying to decide whether or not to buy the
  th house if the transaction costs are
  today:
(2) ![\begin{align*} U &= \max_{\{\text{Buy},\text{Don't}\}} \left\{ \, \mathrm{E}\left[ r_{N+1} \right] - \frac{\gamma}{2} \cdot \mathrm{Var}\left[ r_{N+1} \right] - c, \, 0 \, \right\} \end{align*}](https://alexchinco.com/wp-content/ql-cache/quicklatex.com-a46902401b1630d89d7430853363dbb9_l3.svg "Rendered by QuickLaTeX.com")
You will buy the house if your risk adjusted expectation of its future returns exceeds the transaction costs, ![\mathrm{E}[r_{N+1}] - \sfrac{\gamma}{2} \cdot \mathrm{Var}[r_{N+1}] \geq c](https://alexchinco.com/wp-content/ql-cache/quicklatex.com-867ffdfa0f5d271e48560f1675be0c8e_l3.svg "Rendered by QuickLaTeX.com") .
.
This problem hinges on your ability to estimate . What’s the best you could ever hope to do? Well, suppose you knew which  features mattered ahead of time and the elements of
  were given by
  . In this setting, your average estimation error per relevant feature is given by:
(3) ![\begin{align*} \Omega^\star = \mathrm{E}\left[ \, \frac{1}{K} \cdot \sum_{q=1}^Q \left( \widehat{\alpha}_q - \alpha_q \right)^2 \, \right] &= \frac{K \cdot \sigma_{\epsilon}^2}{N} \end{align*}](https://alexchinco.com/wp-content/ql-cache/quicklatex.com-b6272310d534edf682030d7c3ed48c6d_l3.svg "Rendered by QuickLaTeX.com")
i.e., it’s as if you ran an OLS regression of the price changes on the relevant columns of . You will buy the house if:
(4) 
In the real world, however, you generally don’t know which features are important ahead of time and each house’s amenities are not taken as an iid draw. Instead, you must solve  -type inference problem:
(5) 
with a correlated measurement matrix, , using something like LASSO. In this setting, you face feature selection risk. i.e., you might focus on the wrong causal explanation for the past price movements. If  denotes your estimation error when each of the elements
  are drawn independently and
  denotes your estimation error in the general case when
  , then:
(6) 
Since your estimate of  is unbiased, feature selection risk will simply increase
 ![\mathrm{Var}[r_{N+1}]](https://alexchinco.com/wp-content/ql-cache/quicklatex.com-d2917053055d20863303b1c816aeaf28_l3.svg "Rendered by QuickLaTeX.com") making it less likely that you will buy the house in this stylized model:
making it less likely that you will buy the house in this stylized model:
(7) 
More generally, it will make prices slower to respond to shocks and allow for momentum.
3. Matrix Coherence
Feature selection risk is worst when assets all have really correlated features. Let denote the  -dimensional measurement matrix containing all the features of the houses that have already sold in the market:
(8) 
Each row represents all of the features of the  th house, and each column represents the level to which the assets display a single feature. Let
  denote a unit-normed column from this measurement matrix:
(9) 
I use a measure of the coherence of to quantify the extent to which all of the assets in a market have similar features.
(10) 
e.g., the coherence of a matrix with  is roughly
  corresponding to the red line in the figure below. As the correlation between elements in the same column increases, the coherence increases since different terms in the above cross-product are less likely to cancel out.

4. Selection Risk
There is a tight link between the severity of the selection risk and how correlated asset features are. Specifically, Ben-Haim, Eldar, and Elad (2010) show that if
(11) 
for some  , then:
(12) 
with probability at least:
(13) 
where  . Let’s plug in some numbers. If
  and
and  , then the result means that
  is less than
  with probability
  .
.
There are a couple of things worth pointing out here. First, the recovery bounds only hold when is sufficiently incoherent:
(14) 
i.e., when the assets are too similar, we can’t learn anything concrete about which amenity-specific shocks are driving the returns. Second, the free parameter links the probability of seeing an error rate outside the bounds,  , to the number of amenities that houses have:
(15) ![\begin{align*} \xi &\approx \frac{\log(\sfrac{1}{p}) - \frac{1}{2} \cdot \log\left[ \pi \cdot \log Q \right]}{\sfrac{1}{2} + \log(Q)} \end{align*}](https://alexchinco.com/wp-content/ql-cache/quicklatex.com-b3bec12315aef113f53b17f75c76f277_l3.svg "Rendered by QuickLaTeX.com")
If you want to lower this probability, you need to either use a larger constant or decrease the number of amenities. For  large enough we can effectively regard the error bounds as the variance. Importantly, this quantity is increasing in the coherence of the measurement matrix. i.e., when assets are more similar, I am less sure that I am drawing the correct conclusion from past returns.
5. Empirical Predictions
The main empirical prediction is that in places with less variation in housing amenities, there should be more price momentum since it’s harder to distinguish between noise and amenity-specific value shocks. e.g., imagine studying the price paths of neighborhoods,  and
and  , which have houses of the exact same value,
  . In neighborhood , each of the houses has a very different collection of amenities whose values sum to ; whereas, in neighborhood , each of the houses has the exact same amenities whose values sum to . e.g., you can think about neighborhood as pre-war and neighborhood as tract housing. The theory says that the price of houses in the neighborhood should respond slower to amenity-specific value shocks because houses have more correlated amenities—i.e., is larger. As a result, home prices in neighborhood should also display more momentum… though this is not in the toy model above.
 factor model have lower excess returns. The first result is consistent with existing asset pricing theories; whereas, the second result is at odds with almost any mainstream asset pricing theory you might write down. Idiosyncratic risk should not be priced. This paper together with
 ![\begin{align*} 0 = \mathrm{E}[m \cdot r_n] \quad \text{for all } n=1,2,\ldots,N \end{align*}](https://alexchinco.com/wp-content/ql-cache/quicklatex.com-508a9b2be9012405afbe52f1f9ace924_l3.svg "Rendered by QuickLaTeX.com")
 denotes the expectation operator,
  denotes the stochastic discount factor, and
  today to borrow at the riskless rate, buy a stock, and hold the position for
  period.” Asset pricing theories explain why average excess returns,
 ![\mathrm{E}[r_n]](https://alexchinco.com/wp-content/ql-cache/quicklatex.com-c1c4d3c62fc95adb501bdfff487e1cc8_l3.svg "Rendered by QuickLaTeX.com") , vary across assets even though they all have the same price today by construction (see my earlier
, vary across assets even though they all have the same price today by construction (see my earlier  ,
,  , and noise,
  :
:
 and
and  . I use a Taylor expansion to linearize the function
  and assume
  terms are negligible so
 ![\mathrm{E}[r_n] = \alpha_n + \sfrac{\gamma_n}{2} \cdot \sigma_x^2](https://alexchinco.com/wp-content/ql-cache/quicklatex.com-9a3e91c7bd5a49c76324b127fc7bd134_l3.svg "Rendered by QuickLaTeX.com") and
and ![\mathrm{Var}[r_n] = \beta_n^2 \cdot \sigma_x^2 + \sigma_z^2](https://alexchinco.com/wp-content/ql-cache/quicklatex.com-12e2da3ed43e012d1ce11a6f7a4afbad_l3.svg "Rendered by QuickLaTeX.com") . This means that if the excess return on the market is
. This means that if the excess return on the market is  larger than expected, then asset
  larger.
![\begin{align*} \mathrm{E}[r_n] = \alpha_n + \frac{\gamma_n}{2} \cdot \sigma_x^2 = \underbrace{\text{Constant} \times \beta_n}_{\text{Predicted}} \end{align*}](https://alexchinco.com/wp-content/ql-cache/quicklatex.com-b39998197ded6695fa456331032ccb3b_l3.svg "Rendered by QuickLaTeX.com")
![\text{Constant} = c \cdot (\sfrac{\mathrm{Var}[m]}{\mathrm{E}[m]})](https://alexchinco.com/wp-content/ql-cache/quicklatex.com-f0e508f53a2eab3a7440848bea6904b4_l3.svg "Rendered by QuickLaTeX.com") , depends on the exact asset pricing model. Equation (
, depends on the exact asset pricing model. Equation (

 shows up in the expression for
  ; however, idiosyncratic volatility,
  , better not be priced since it shows up nowhere above.
 . The authors actually look at each stock’s exposure to changes in aggregate volatility. To see how this changes the math, consider rewriting the intercept above as:
 around its mean with some small
  will impact the estimated intercept:
![\begin{align*} \mathrm{A}_n(\Delta \sigma_x) &= \mathrm{A}_n(0) + \mathrm{A}_n'(0) \cdot \Delta \sigma_x + \cdots \\ &\approx \left[ \alpha_n + \frac{\gamma_n}{2} \cdot \langle\sigma_x\rangle^2 \right] + \gamma_n \cdot \langle\sigma_x\rangle \cdot \Delta \sigma_x \end{align*}](https://alexchinco.com/wp-content/ql-cache/quicklatex.com-e4767386cedfa210b242c920cb810f29_l3.svg "Rendered by QuickLaTeX.com")
 by definition,
  and
and  will have the same sign. Thus, testing for whether exposure to changes in aggregate volatility is priced is tantamount to testing for whether exposure to aggregate volatility is priced.
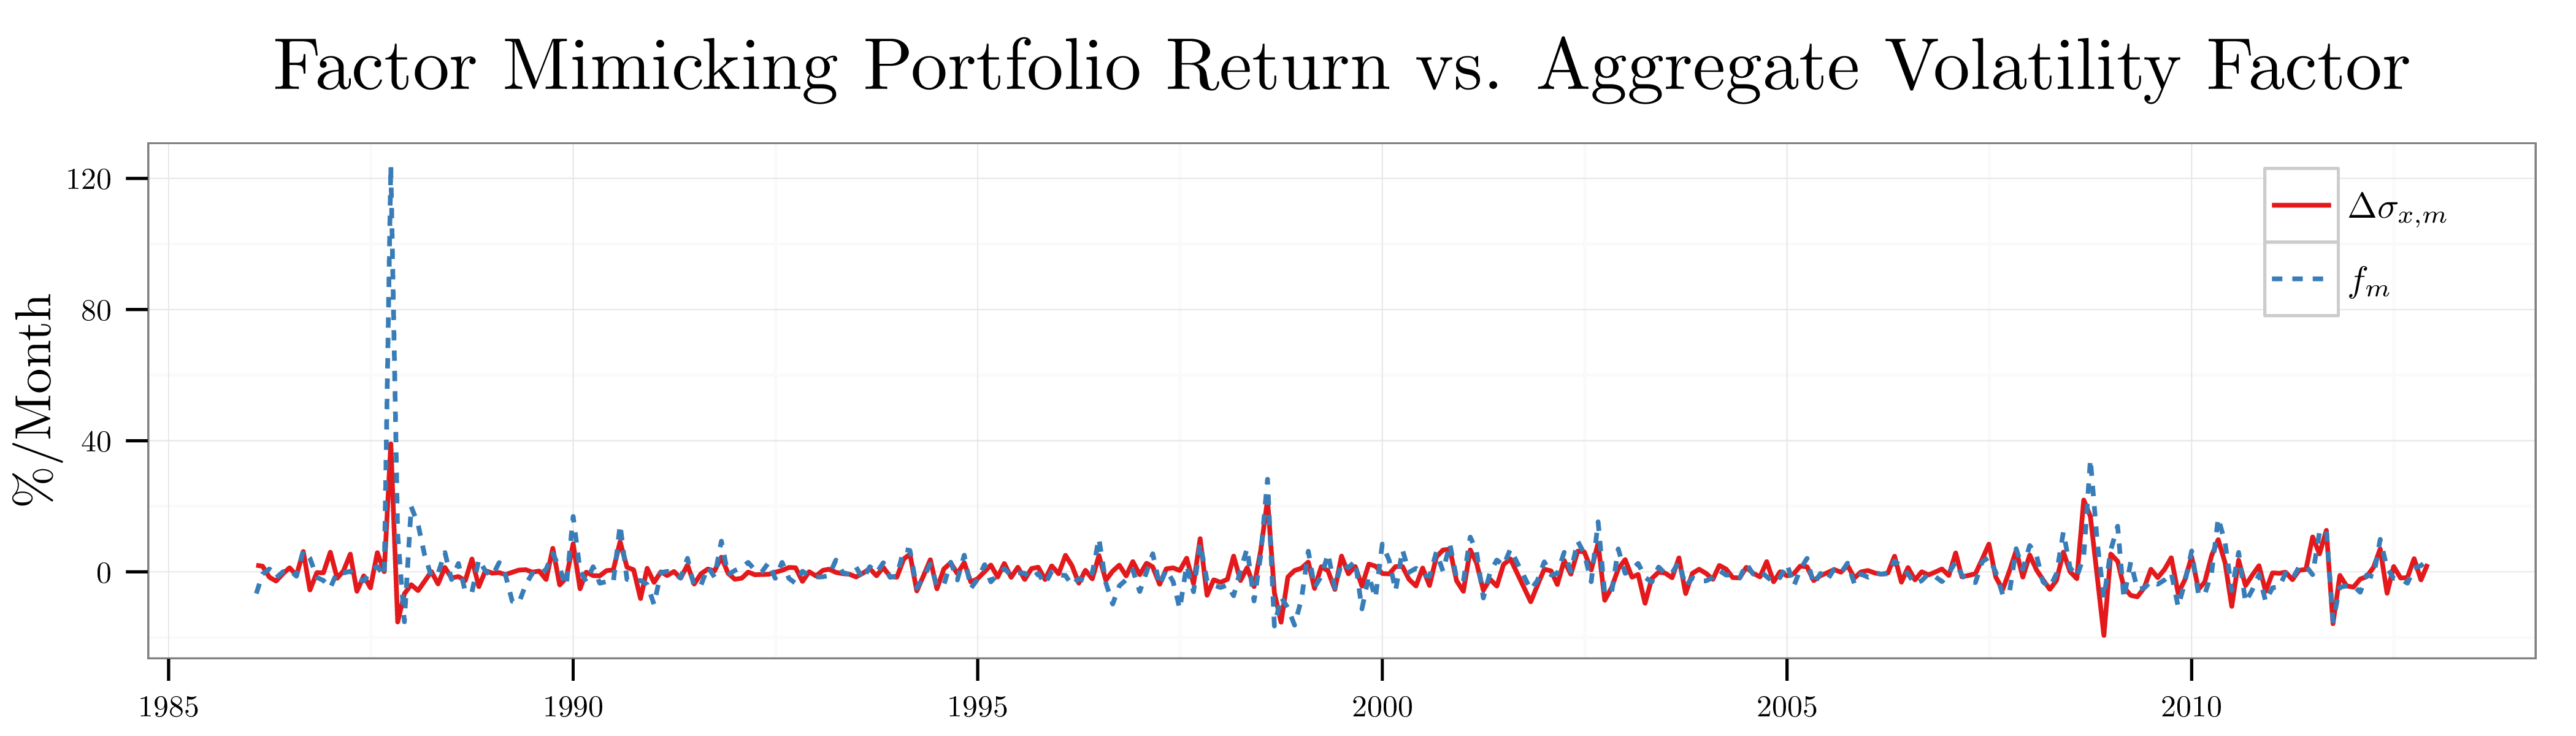
 steps. First, they calculate the changes in aggregate volatility time series using changes in the daily options implied volatility:
![\begin{align*} \Delta \sigma_{x,d+1} = \mathit{VXO}_{d+1} - \mathit{VXO}_d \qquad \text{with} \qquad \mathrm{E}[\Delta \sigma_{x,d+1}] = 0.01{\scriptstyle \%}, \, \mathrm{StD}[\Delta \sigma_{x,d+1}] = 2.65{\scriptstyle \%} \end{align*}](https://alexchinco.com/wp-content/ql-cache/quicklatex.com-1fcb5273efb718f3d57f082e0e6e35a9_l3.svg "Rendered by QuickLaTeX.com")
 , then options markets expect the S&P 100 to move up or down
  calendar days. The authors use the VXO contract price rather than the VIX contract price because it has a longer time series dating back to 1986. The only difference between the
  over the sample period from January 1986 to December 2012 as shown in the figure below.
 using the daily data in month
  :
:

 , is the excess return on the CRSP value-weighted market index. I include AMEX, NYSE, and NASDAQ stocks with
  daily observations in month
 . Note that because the factor
  is common to all stocks in month
  . For each portfolio
  with
with  denoting the stocks with the lowest aggregate volatility exposure and
  denoting the stocks with the highest aggregate volatility exposure, the authors then calculate the daily portfolio returns in month
  in the low aggregate volatility exposure portfolio in January 1986, then you would have over
  more dollars in December 2012 than if you had invested that same


 . They then define the factor mimicking portfolio return at daily horizon in month


 coefficients in the figure below. Consistent with the idea that exposure to aggregate volatility is driving the disparate excess returns of the
 :
:

![\begin{align*} \sigma_{z,n} &= \mathrm{StD}[\mathit{Error}_{n,d}] \end{align*}](https://alexchinco.com/wp-content/ql-cache/quicklatex.com-0e07c5257a89dc3d311fe765f3ef3663_l3.svg "Rendered by QuickLaTeX.com")

 values. The figure above reports the cumulative returns to these
  more in December 2012 than if you had invested in the high idiosyncratic volatility portfolio. The figure below reports the estimated abnormal returns,
  , for each of the idiosyncratic volatility portfolios over the full sample and confirms that the poor performance of the high idiosyncratic volatility portfolio cannot be explained by exposure to common risk factors.

 where the red lines denoting the low exposure portfolios behave in completely different ways. e.g., the low aggregate volatility exposure portfolio returns behave more or less like the high aggregate volatility exposure portfolio returns but with a higher mean. By contrast, the low idiosyncratic volatility portfolio returns are a much different time series with dramatically less volatility. Interestingly, if the authors sort on total volatility in month
  in month
 hours that changes how awesome it is to have an additional
  , then the stochastic discount factor is
  and the stuff (i.e., risk factor) is changes in log consumption.
 and
and  , the following identity holds:
![\begin{equation*} \mathrm{E}[u\cdot v] = \mathrm{Cov}[u,v] - \mathrm{E}[u] \cdot \mathrm{E}[v] \end{equation*}](https://alexchinco.com/wp-content/ql-cache/quicklatex.com-16993b6a2e80a877af59cc50e0d6c8f5_l3.svg "Rendered by QuickLaTeX.com")
![\begin{align*} \mathrm{E}[r_n] &= \frac{\mathrm{Cov}[m, r_n]}{\mathrm{Var}[m]} \cdot \left( - \frac{\mathrm{Var}[m]}{\mathrm{E}[m]} \right) \end{align*}](https://alexchinco.com/wp-content/ql-cache/quicklatex.com-023d62367a131093e91202e01a0bdebd_l3.svg "Rendered by QuickLaTeX.com")
 , is common across all assets, and represents the price of exposure to the risk factor
 ![\mathrm{E}[x] = \mu_x](https://alexchinco.com/wp-content/ql-cache/quicklatex.com-6411ed9752816dd91538c8e365d12b4c_l3.svg "Rendered by QuickLaTeX.com") and
and ![\mathrm{Var}[x] = \sigma_x^2](https://alexchinco.com/wp-content/ql-cache/quicklatex.com-f44c7d370b1b9e635a871c3e8e69c523_l3.svg "Rendered by QuickLaTeX.com") . I then write the stochastic discount factor as the sum of a function of
. I then write the stochastic discount factor as the sum of a function of  , and some noise,
  :
:
![\mathrm{E}[m] = \phi + \sfrac{\psi}{2} \cdot \sigma_x^2](https://alexchinco.com/wp-content/ql-cache/quicklatex.com-a8070063ca4ebee8f50073cd8ae6c321_l3.svg "Rendered by QuickLaTeX.com") and
and ![\mathrm{Var}[m] = \chi^2 \cdot \sigma_x^2 + \sigma_y^2](https://alexchinco.com/wp-content/ql-cache/quicklatex.com-a9ec188a9b386204745dc4f85913fbde_l3.svg "Rendered by QuickLaTeX.com") . This means that if the risk factor is
. This means that if the risk factor is  , then agents value having an additional
  more than usual. Similarly, suppose each excess return is the sum of an asset-specific function of
  larger than average.
![\begin{equation*} \begin{split} \mathrm{E}[r_n] &= \frac{\mathrm{Cov}[m,r_n]}{\mathrm{Var}[m]} \cdot \left( - \, \frac{\mathrm{Var}[m]}{\mathrm{E}[m]} \right) \\ &= \frac{\chi \cdot \beta_n \cdot \sigma_x^2}{\chi^2 \cdot \sigma_x^2 + \sigma_y^2} \cdot \left( - \, \frac{\chi^2 \cdot \sigma_x^2 + \sigma_y^2}{\phi + \frac{\psi}{2} \cdot \sigma_x^2} \right) \\ &= - \, \left( \frac{\chi \cdot \sigma_x^2}{\phi + \frac{\psi}{2} \cdot \sigma_x^2} \right) \cdot \beta_n \\ &= \text{Constant} \times \beta_n \end{split} \end{equation*}](https://alexchinco.com/wp-content/ql-cache/quicklatex.com-83e50959264021c3181adf48cea6e6c0_l3.svg "Rendered by QuickLaTeX.com")
 . Assets which have higher realized returns when the risk factor is high (have a large
  , is proportional to its exposure to the risk factor,
 ![\begin{align*} \mathrm{E}[r_n] = \underbrace{\alpha_n + \frac{\gamma_n}{2} \cdot \sigma_x^2}_{\text{Realized } \langle r_n \rangle} = \underbrace{- \, \left( \frac{\chi \cdot \sigma_x^2}{\phi + \frac{\psi}{2} \cdot \sigma_x^2} \right) \cdot \beta_n}_{\text{Predicted}} \end{align*}](https://alexchinco.com/wp-content/ql-cache/quicklatex.com-8a4215c40d3fb29e2ec057faa7091723_l3.svg "Rendered by QuickLaTeX.com")
 we can interpret this relationship as a realization of the first
 ![\begin{align*} \frac{\mathrm{StD}[m_{t+1}]}{\mathrm{E}[m_{t+1}]} = \frac{\chi \cdot \sigma_x}{\phi + \frac{\psi}{2} \cdot \sigma_x^2} = \frac{\alpha_n + \frac{\gamma_n}{2} \cdot \sigma_x^2}{\beta_n \cdot \sigma_x} = \left| \frac{\mathrm{E}[r_{n,t+1}]}{\mathrm{StD}[r_{n,t+1}]} \right| \end{align*}](https://alexchinco.com/wp-content/ql-cache/quicklatex.com-38383535590884c4f38e581d8647b4b0_l3.svg "Rendered by QuickLaTeX.com")
 unknown parameters:
 periods of observations. i.e.,
  equations to estimate these parameters with via
  assets:
![\begin{align*} \begin{pmatrix} 0 \\ 0 \\ \vdots \\ 0 \\ 0 \\ \vdots \\ 0 \\ 0 \\ \vdots \\ 0 \end{pmatrix} &= \mathrm{E}[\mathrm{G}(\widehat{\boldsymbol \theta};\mathbf{r}_t,x_t)] = \mathrm{E} \begin{bmatrix} x_t - \widehat{\mu}_x \\ r_{1,t} - \left\{ \widehat{\alpha}_1 + \widehat{\beta}_1 \cdot (x_t - \widehat{\mu}_x) \right\} \\ \vdots \\ r_{N,t} - \left\{ \widehat{\alpha}_N + \widehat{\beta}_N \cdot (x_t - \widehat{\mu}_x) \right\} \\ \left( r_{1,t} - \left\{ \widehat{\alpha}_1 + \widehat{\beta}_1 \cdot (x_t - \widehat{\mu}_x) \right\} \right) \cdot (x_t - \widehat{\mu}_x) \\ \vdots \\ \left( r_{N,t} - \left\{ \widehat{\alpha}_N + \widehat{\beta}_N \cdot (x_t - \widehat{\mu}_x) \right\} \right) \cdot (x_t - \widehat{\mu}_x) \\ r_{1,t} - \widehat{\beta}_1 \cdot \widehat{\lambda} \\ \vdots \\ r_{N,t} - \widehat{\beta}_N \cdot \widehat{\lambda} \end{bmatrix} \end{align*}](https://alexchinco.com/wp-content/ql-cache/quicklatex.com-0d7036149fac2068adb1977f18c0c148_l3.svg "Rendered by QuickLaTeX.com")
 equations identify the
  parameters governing the relationship between the risk factor and each asset’s excess returns. The final
  , for exposure to the risk factor
  .
.
 and
and  ,
,  , and
, and  are not identifiable from this approach since they satisfy conservation laws which leave the estimates for
 and decrease
  , then the estimate of
  month windows to estimate each asset’s
  . Is this too long a window relative to how much factor exposures vary over time? Alternatively, should we be using a longer window to more accurately pin down these parameters? It turns out that the estimation strategy gives some guidance about the relationship between the optimal estimation window and parameter persistence which I discuss below.
 . Suppose the true market price of risk,
  , follows a random walk:
 so that the final
  is a random variable with distribution:

 denotes estimation error from the GMM procedure. There is an additional complication to consider. Namely, if the true market price of risk is floating around during the estimation period, it will add additional noise to the parameter estimates and increase
  . To keep things simple, suppose that nature sets the market price of risk to
 ![\begin{align*} T = \arg \min_{T \geq 0} \mathrm{E}\left[ (\lambda_T - \widehat{\lambda})^2 \right] = \arg \min_{T \geq 0} \mathrm{E}\left[ (\lambda_T - \lambda)^2 + (\lambda - \widehat{\lambda})^2 \right] \end{align*}](https://alexchinco.com/wp-content/ql-cache/quicklatex.com-467158ef5da5daab7017885f6c5ef1d2_l3.svg "Rendered by QuickLaTeX.com")
![\begin{align*} 0 = \frac{d}{dT} \left[ T \cdot \sigma_l^2 + \left(\frac{1}{\sigma_{\lambda}^2} + \frac{T}{\sigma_s^2} \right)^{-1} \right] \end{align*}](https://alexchinco.com/wp-content/ql-cache/quicklatex.com-153fe27339fd548d4c7d9198ce9a1ed7_l3.svg "Rendered by QuickLaTeX.com")
 denotes the variance of my priors about the market price of risk governing the estimation sample
![\begin{align*} \begin{pmatrix} 0 \\ 0 \\ 0 \\ 0 \end{pmatrix} &= \mathrm{E}[\mathrm{G}(\widehat{\boldsymbol \theta};r_t,x_t)] = \mathrm{E} \begin{bmatrix} x_t - \widehat{\mu}_x \\ r_t - \left\{ \widehat{\alpha} + \widehat{\beta} \cdot (x_t - \widehat{\mu}_x) \right\} \\ \left( r_t - \left\{ \widehat{\alpha} + \widehat{\beta} \cdot (x_t - \widehat{\mu}_x) \right\} \right) \cdot (x_t - \widehat{\mu}_x) \\ r_t - \widehat{\beta} \cdot \widehat{\lambda} \end{bmatrix} \end{align*}](https://alexchinco.com/wp-content/ql-cache/quicklatex.com-20202e553631746df71f98477b1607e9_l3.svg "Rendered by QuickLaTeX.com")
 , then GMM reduces to OLS and
  since:


 , then
  and you should pick
  or as large as possible. Second, notice that if you already know the true
  and you should pick
  . Finally, notice that if the test asset has no exposure to the risk factor,
  , then the equation is undefined since any window length gives you the same amount of information—i.e., none.
 different attributes and traders try to identify which
  of these attributes matter via price changes:
![\begin{align*} \Delta p_n &= p_n - \mathrm{E}[p_n] = \sum_{q=1}^Q \beta_q \cdot x_{n,q} + \epsilon_n \qquad \text{where} \qquad K = \Vert {\boldsymbol \beta} \Vert_{\ell_0} = \sum_{q=1}^Q 1_{\{ \beta_q \neq 0 \}} \notag \end{align*}](https://alexchinco.com/wp-content/ql-cache/quicklatex.com-61b486123cee5de4e870b72d62eeaa04_l3.svg "Rendered by QuickLaTeX.com")
 and the noise is given by
  . In the limit as
  ,
,  ,
,  , and
, and  there exists both a signal opacity bound,
  , as well as a signal recovery bound,
  :
: 
 in units of transactions. I explain what I mean by “
 ” in Section 4 below. These
  ) from the regions where traders can almost surely identify the shocked attributes (i.e.,
  ). i.e., if traders have seen fewer than
  different amenities:
  a
a  a third bedroom,
  a half-circle driveway,
  granite countertops,
  energy efficient appliances,
  central A/C, or
  a walk-in closet? The mystery amenity is raising the sale price of some houses by
  dollars. How many sales do you need to see in order to figure out which of the
  , a second house with amenities
  , and a third house with amenities
  . The combination of the price changes for these
 ![\Delta p_1 = p_1 - \mathrm{E}[p_1] = \beta](https://alexchinco.com/wp-content/ql-cache/quicklatex.com-192f208edef697e5db9b60ed0bf7e90d_l3.svg "Rendered by QuickLaTeX.com") , then Chicagoans must have changed their preferences for
, then Chicagoans must have changed their preferences for 
 , then people must value walk-in closets more than they did a year ago.
 observations.
  .
.  .
.  sales only allows you to distinguish between subsets of amenities. e.g., seeing just the first and second houses with unexpectedly high prices only tells you that people like either half-circle driveways or walk-in closets more… not which one.
 . This is no longer true in higher dimensions. i.e., even in the absence of any noise, seeing any fraction
  of the required observations for
  will leave you with an error rate that is within a tiny neighborhood of
  as the number of attributes gets large.
 shock and the data matrix is non-random. Specifically, I look at the case where
  . My goal is to build some intuition about what I should expect in the more complicated setting where the data
  -dimensional and look like:
![\begin{equation*} \underset{4 \times 15}{\mathbf{X}} = \left[ \begin{matrix} 1 & 0 & 1 & 0 & 1 & 0 & 1 \\ 0 & 1 & 1 & 0 & 0 & 1 & 1 \\ 0 & 0 & 0 & 1 & 1 & 1 & 1 \\ 0 & 0 & 0 & 0 & 0 & 0 & 0 \end{matrix} \ \ \ \begin{matrix} 0 & 1 & 0 & 1 & 0 & 1 & 0 & 1 \\ 0 & 0 & 1 & 1 & 0 & 0 & 1 & 1 \\ 0 & 0 & 0 & 0 & 1 & 1 & 1 & 1 \\ 1 & 1 & 1 & 1 & 1 & 1 & 1 & 1 \end{matrix} \right] \end{equation*}](https://alexchinco.com/wp-content/ql-cache/quicklatex.com-c9654d5e3c73000da35573acd23905a3_l3.svg "Rendered by QuickLaTeX.com")
 in binary.
 be a function that eats
  attributes each:


 th observation then closes the case against the offending attribute.
 matters when computing the size of the output of
  transaction, then they can tell which subset of
  attributes has realized a shock. If traders have seen
  transactions, then they can tell which subset of
  attributes has realized a shock. If traders have seen
  observations, then they can tell which subset of
  attributes has realized a shock. Thus, after seeing any number of observations
  , traders can place the shock in a set of size
  . i.e., a trader has the same amount of information about which attribute has realized a shock in (i) a situation where
  and he’s seen
  transactions as in (ii) a situation where
  assuming uniform priors. Natural numbers are hard to work with analytically, so let’s suppose that traders observe some fraction of the required number of observations
  observations. We can then perform a change of variables
  and answer the question: “How much does getting
 ![\begin{align*} \frac{1}{N_R} \cdot \frac{d}{d\alpha}\left[ \, 2^{- (N_R - N)} \, \right] = - \log(2) \cdot e^{- \alpha \cdot \log(2) \cdot N_R} \end{align*}](https://alexchinco.com/wp-content/ql-cache/quicklatex.com-aed714b93d9cbbf093a71edae530f1c7_l3.svg "Rendered by QuickLaTeX.com")
 to
to  below. When
  transactions (i.e.,
  of
of  a trader’s predictive power doesn’t start to improve until he’s seen
  transactions (i.e.,
  of
of  useful information about which attributes realized a shock until they come within a hair’s breadth of the signal recovery bound
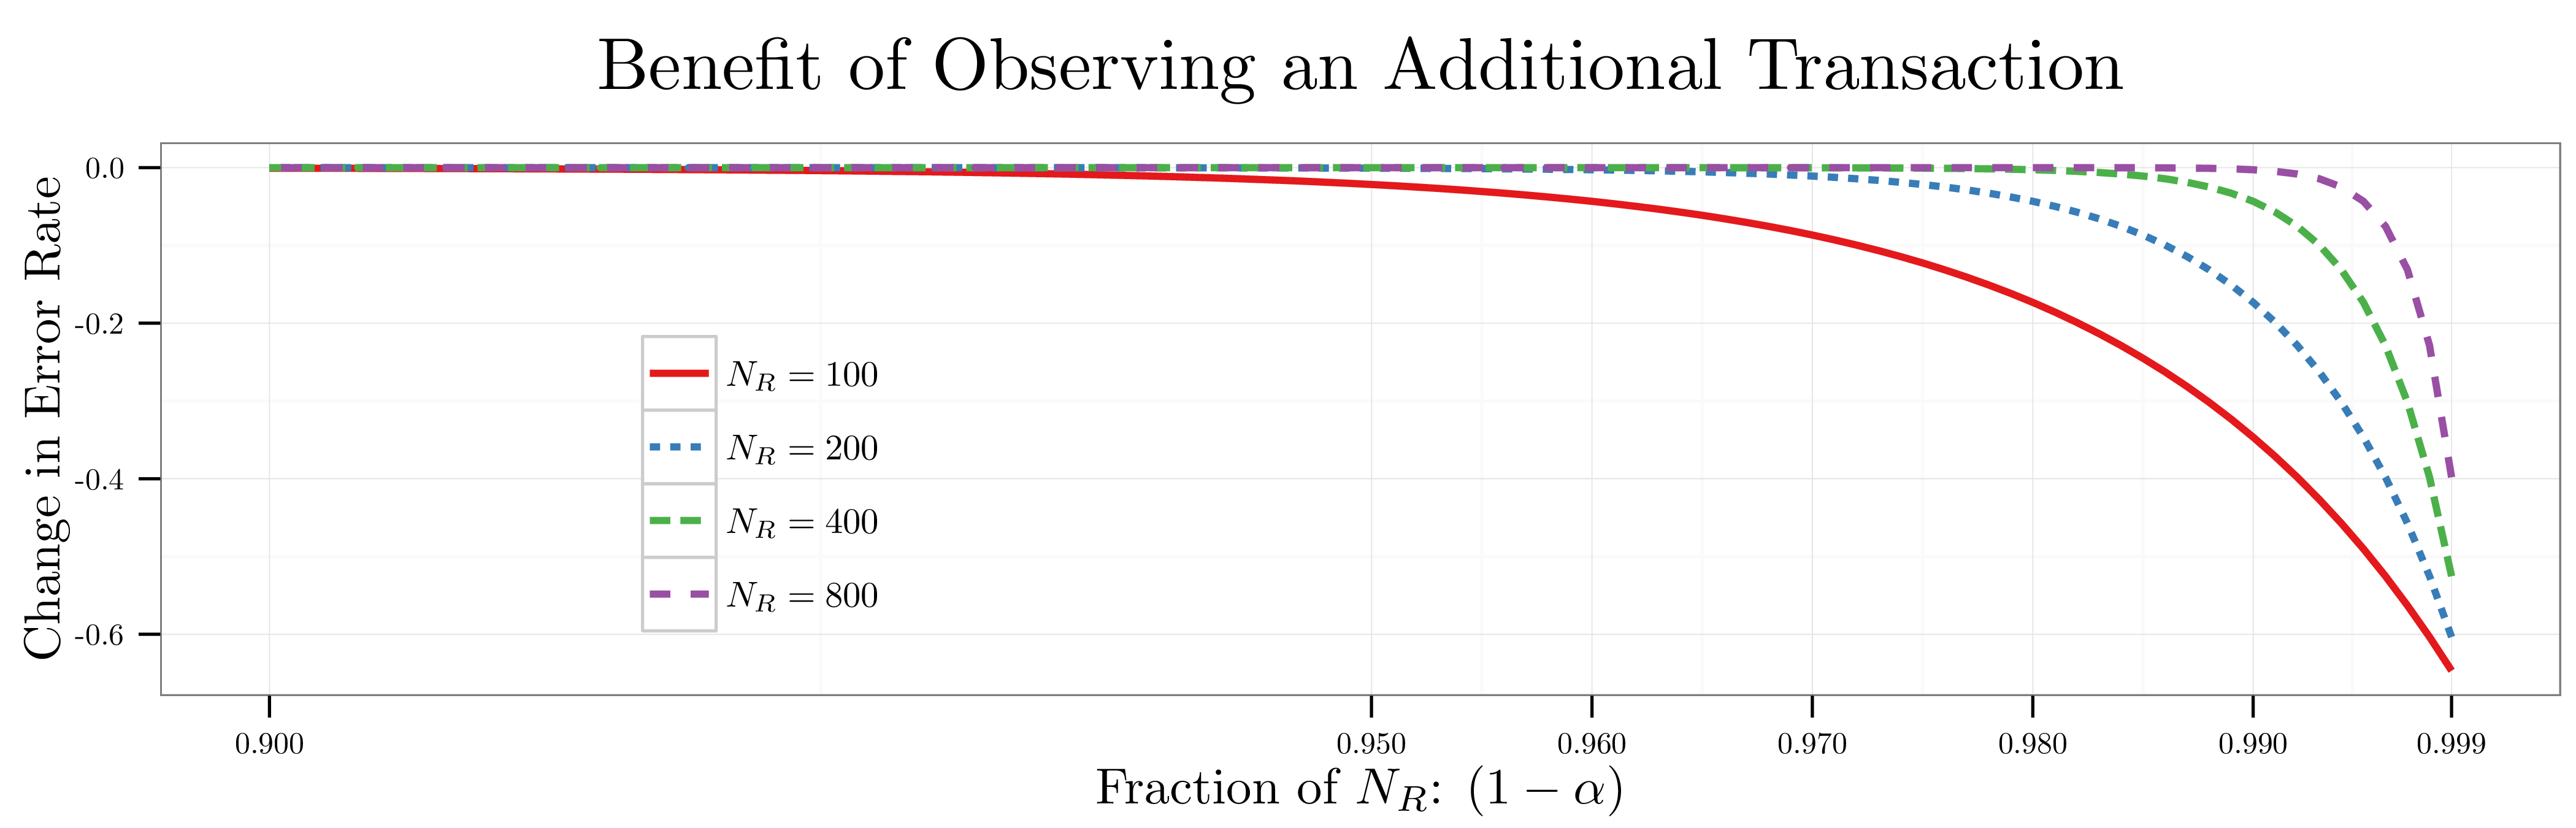
 :
:
 denotes idiosyncratic shocks affecting asset
  with
with  , I want to know whether solving the linear program:
 when it is
  . Since
  the linear system is underdetermined; however, if the level of sparsity is sufficiently high (i.e.,
  ), and I ask: “What is the minimum number of observations needed to identify the true
  for
for  using the linear program in Equation (
 ) by increasing the number of attributes (i.e.,
  ).
). ,
,  , and
, and  with
with  . The linear program in Equation (
 .
. ), and I ask: “How many observations do traders need to see in order to identify the true
 ![\begin{align*} \mathrm{Err}[N] &= \frac{1}{{Q \choose K}} \cdot \sum_{\substack{\mathcal{K} \in \mathcal{Q} \\ |\mathcal{K}| = K}} \mathrm{Pr}(\widehat{\boldsymbol \beta} \neq {\boldsymbol \beta}) \end{align*}](https://alexchinco.com/wp-content/ql-cache/quicklatex.com-34cf0d5b92083a52a184ce78eec484c8_l3.svg "Rendered by QuickLaTeX.com")
 denotes the probability that the linear program in Equation (
 and averaging over not only the measurement noise,
  , but also the choice of the Gaussian attribute exposure matrix,
  with probability
 ![\begin{align*} \lim_{\substack{K,N,Q \to \infty \\ \sfrac{K}{Q} \to 0}} \mathrm{Err}[N] &= 0 \end{align*}](https://alexchinco.com/wp-content/ql-cache/quicklatex.com-58c9bb88049ae8e5206718106055daf5_l3.svg "Rendered by QuickLaTeX.com")
 :
:
 constrained linear programming is NP-hard. This cognitive constraint is really weak in the sense that any selection rule that you might look up in an econometrics or statistics textbook (e.g., forward stepwise regression or LASSO) is going to be computationally tractable. After all, they have to be executed on computers.


 or
or  . i.e., I exclude things like ADRs, closed-end funds, and REITS. I calculate weekly returns by compounding daily returns between adjacent Wednesdays:
 industry classification system from
  to denote the number of securities in industry
  in year
  . In each of the figure below, I report the average number of firms in each industry on an annual basis over the sample period:
 June observations.
 of stocks in each industry and the smallest
![\begin{align*} \mu_B &= \mathrm{E}[\tilde{r}_{i,t}^B] \qquad \text{and} \qquad \sigma_B = \mathrm{StDev}[\tilde{r}_{i,t}^B] \\ \mu_S &= \mathrm{E}[\tilde{r}_{i,t}^S] \qquad \text{and} \qquad \sigma_S = \mathrm{StDev}[\tilde{r}_{i,t}^S] \\ r_{i,t}^B &= \frac{\tilde{r}_{i,t}^B - \mu_B}{\sigma_B} \qquad \text{and} \qquad r_{i,t}^S = \frac{\tilde{r}_{i,t}^S - \mu_S}{\sigma_S} \end{align*}](https://alexchinco.com/wp-content/ql-cache/quicklatex.com-7f86119dea9097af14f15c1eeaa7cc11_l3.svg "Rendered by QuickLaTeX.com")
 and the subsequent returns of the small portfolio in week
  I run the regression:
![\beta(l) = \mathrm{Cor}[r_{i,t}^B,r_{i,t+l}^S]](https://alexchinco.com/wp-content/ql-cache/quicklatex.com-a4171455cbbb804c41b5fc4d561e4bae_l3.svg "Rendered by QuickLaTeX.com") . Similarly, to estimate the correlation between the returns of the small portfolio in week
. Similarly, to estimate the correlation between the returns of the small portfolio in week 
![\gamma(l) = \mathrm{Cor}[r_{i,t}^S,r_{i,t+l}^B]](https://alexchinco.com/wp-content/ql-cache/quicklatex.com-e3d1afec4ef14cf19499b968d4c3b08e_l3.svg "Rendered by QuickLaTeX.com") . The advantage of this approach over estimating a simple correlation matrix is that you can read off the standard errors from the regression results rather than rely on asymptotic results.
. The advantage of this approach over estimating a simple correlation matrix is that you can read off the standard errors from the regression results rather than rely on asymptotic results.
 and
and  respectively at lags of
  weeks. The shaded regions around the solid lines are the
  standard deviations above their mean in week
  . By contrast, the smallest consumer non-durables securities have no predictive power over the future returns of their larger cousins.
 of securities in each industry as opposed to the largest

You must be logged in to post a comment.